Earlier this year I wrote a piece about how the Veikkausliiga struggles in part because they are unable to retain or recruit quality peak age players. In it, I suggested that a potential solution to this problem would be a retooling of the recruitment strategy of foreign players, foregoing highly populated major markets, where Finnish teams have to fight tooth and nail for the final crumbs of quality against teams of far superior means, and rather investing in identifying talents in lower rated leagues than Finland, thereby creating an upward trajectory for the players making the move. I thought I’d expand a little on some of the leagues I suggested, and show some basic tools for doing this type of analysis, using largely public, crowdsourced data.
This post will be the first part in a series of as yet unknown length, which will be about making smarter recruitment decisions as efficiently as possible, using either publicly available (or as cheap as possible) tools and data. The purpose of the series is to show that there are ways of developing fact based football processes even within severe budget constraints, so I’ll try to give practical examples at every step of the way.
When looking at potential target markets, the first step of the process is to have some sort of system through which to analyze the differences in strength between leagues. When making these types of league comparisons, the first problem is creating sensible league tiering, so as to get a rough idea of whether a league is similar in strength, better, or worse. This is something that is difficult to do well due to the rarity of inter-league games (especially in the lesser leagues and lower tiers as well as between teams from different continents). Optimally, teams in different leagues would play each other in competitive fixtures often enough that one could quite easily measure the respective quality of each league, but that isn’t something that we can rely on here. Instead, we’re going to take a sip from the poisoned chalice, we’re going to open Pandora’s box. Oh yes, that’s right, we’re going to use Transfermarkt Market Value.
Generally speaking, Transfermarkt could be considered both the most overrated tool in modern football, as well as the most underrated. Their market value is essentially a subjective crowdsourced assessment of every player’s value, measured in the hypothetical price that the market would put on the player. This usually manifests in gross oversimplifications of something that is often almost impossible to objectively gauge from the outside. That being said, the website is also an invaluable resource for keeping track of player movement, basic information about players as well as some more detailed (although maybe not quite 100% trustworthy) stuff like contract information.
Even though the Transfermarkt Market Value isn’t particularly accurate when estimating transfer fees, it does serve a purpose as a very general approximation of a player’s overall value – especially if you aggregate it to the team or, even better, league level. What I mean by this is that although the Market Value might be extremely off in estimating the value of a single player, if we look at the league level, it might be a passable – or better – measure for the average value of all the players in the league – especially if it is used for inter-league comparison.
So if we calculate the average market value per player for each league on transfermarkt, we’ll have a starting point for our tiering system. The most basic smell test for this exercise is whether the top 10 leagues make sense, as they are fairly well established. If they do, then we can be slightly more comfortably using it for the lower levels of football. Again, as a reminder, we’re not so interested in the actual amount of monopoly money a player is estimated to be worth, rather just the rough ordering of the leagues by this measure.

Top 10 looks… alright actually. A clear separation between the top 5 and the rest, and the Premier League as the clear #1. Maybe there could be a debate about the internal placings, but that isn’t something I’m particularly interested in partaking in. I’m satisfied.
The next step is to separate the leagues into tiers – for this I played around with some different alternatives and settled on 18 tiers with 12 leagues per tier, except the 18th which is leagues with an average Transfermarkt Market Value of zero and the 17th which ended up containing the final leagues before zero value. The full list of leagues (apart from tiers 17 and 18) can be found in the grid below. You might need to use some creativity to interpret the labels, as they are transfermarkt’s league ids, but it’s nothing a quick google won’t help with.

Once we have the league tiers, we can start looking at transfers between the leagues. For this exercise, what interests us is what proportion of players make successful moves between tiers – we’ll temporarily disregard the bottom two tiers because they’re differently sized than the other tiers. Here, again, we’re going to have to get creative, as success can be an ambiguous concept. Optimally, we would have some sort of sophisticated measure to describe the success of each transfer, but since we’re working with what we have, what we’re going to use instead, is minutes played. I’ve long been an advocate of playing time as a proxy for quality. It’s widely available, and it contains a lot of information, so it’s much better than it might sound, but it’s still a bit of a patchwork solution. In any case, if we look at the transfers made between the different tiers, and look at the proportion of playing time the transferred player has received in the following season we can get a 16-by-16 matrix that looks like this.

A quick note on the data: due to the way in which I scraped the data I don’t have the exact date (or even the transfer window) in which the transfer happened. This makes it difficult to create a set of rules that would treat winter transfers the same as summer transfers, or summer centric and winter centric leagues. This is why we’re looking at the following season’s minutes rather than the same season’s – as some transfers happen halfway through the season and therefore differ quite a lot. The major drawback from this approach is that buying a player one summer, then selling them the next summer for a profit, would be considered a bad transfer as the player wouldn’t accumulate any minutes for the buying team in the season following the season of the transfer. These types of transfers would be nice to catch in some way, as they are pretty good examples of good transfers, but we’ll allow them to slip through the cracks in favor of having an approach that favors slightly longer term on-pitch value.
The most noticeable pattern in the above matrix is fairly intuitive – a darkening of the color as we move toward the top left corner. Essentially, for the teams in the top tiers, the best business is done within a fairly select few leagues. If we look at the bottom rows, there isn’t really a clear pattern to identify – essentially, the lower tiered the league you are moving to, the less it matters where you’re coming from. If transfers to tier 9 as an example (the one containing the Veikkausliiga), there doesn’t seem to be any pattern at all, with players from tier 16 having a higher rate of success than players from tier 1, and players from tier 13 having a lower success rate than players from tier 3.
To sanity check the methodology, let’s have a look at some of those transfers to the Veikkausliiga.
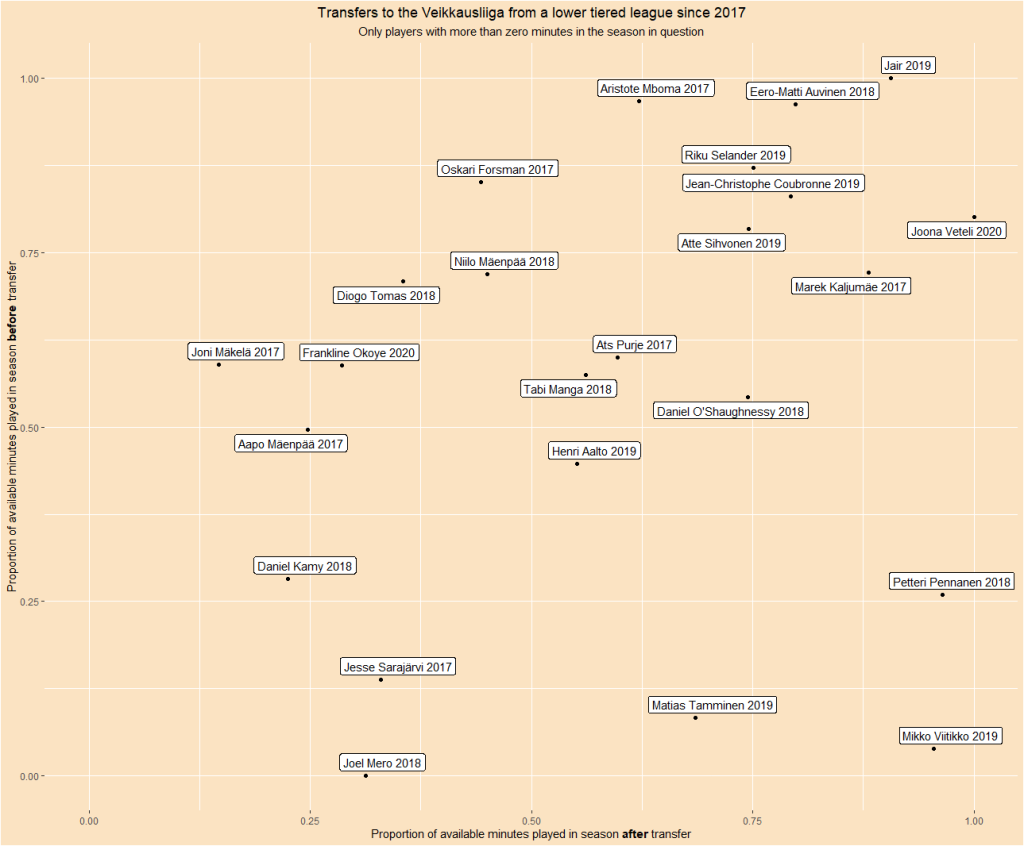
In the above picture, we’re essentially considering the transfer more successful the further right it is placed. On the face of it, it seems to work alright. We can see Petteri Pennanen, Daniel O’Shaughnessy, Joona Veteli, Jair and Jean-Christophe Coubronne on the right hand side, and Jesse Sarajärvi, Frankline Okoye on the left hand side. There are some questionable ones – Diogo Tomas for one – but that’s to be expected. It isn’t perfect, but looks good enough for our purpose. Let us consider sanity checked.
The next step is to have a look at some of the leagues. Our purpose is to identify good target markets for Finland, and as such we need to understand the market constraints. If we want to be proactive in our recruitment, there’s no point in scouting tiers 1-5, as the good players in those tiers will have too many other options to choose from before they become available to the Veikkausliiga. Therefore, we’ll check how well a league does when moving players to a higher tier using the proportion of available minutes a player has received when moving to a better league. This is calculated by looking at that league-season’s max minutes, and dividing the player’s game time by that. We’ll only consider leagues with over 100 outgoing transfers to better leagues in the past 10 seasons. This way, we can hone in on lower tiered leagues that manage to produce good transfers more regularly than others.
Let’s start by having a look at the top 10 tiers (meaning 2-11, as you can’t make a move to a higher tier from tier 1).

I think it’s interesting to note the strong performance of the Nordic leagues – both top and second tiers – but also the comparatively low performance of the Veikkausliiga, maybe not unsurprisingly. The Veikkausliiga, however does do quite a lot better than the Icelandic league (coming up in the next graphic), which is maybe viewed more as a hotbed for talent.
Overall, loads of interesting information – check out Serie B! – but maybe not so much for the Finnish league. For that, we need to dig deeper. Let’s have a look at tiers 12-18. In order to make them easier to represent graphically, I separated tier 18 into four sub-tiers.
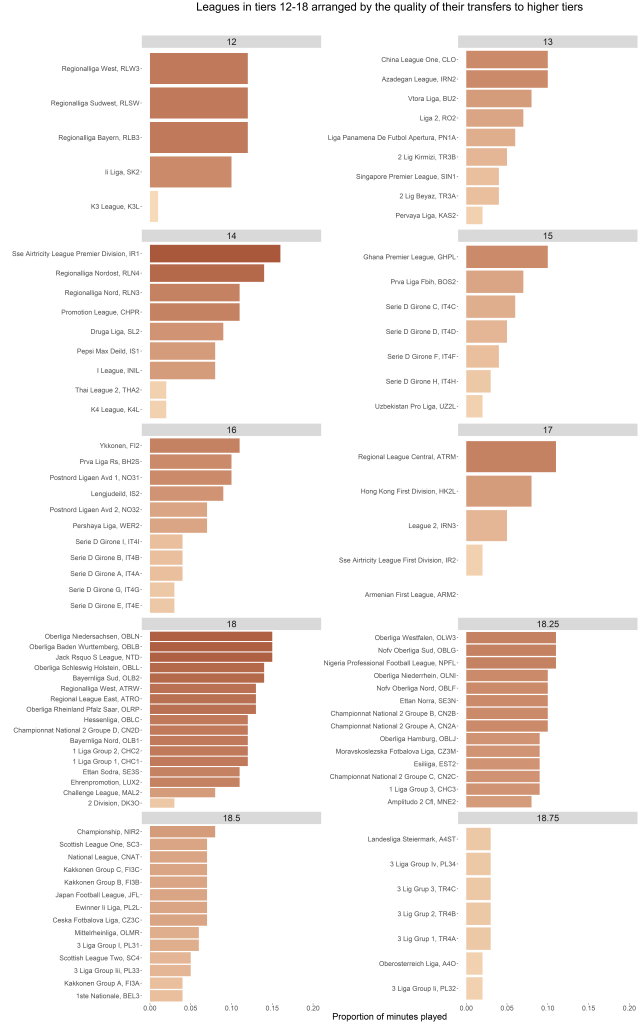
Tier 18 has some interesting picks – specifically some German and Dutch lower tiers. Among the lower tiers, the Irish league also performs surprisingly strongly. Previously, I had posited that Eastern Asia and North America might be fertile ground for Finnish teams to establish themselves, but based on the above analysis, that doesn’t look like such a good idea, as tiers two and three of Japanese football, the top two tiers of Korean football and the top two tiers of US football score fairly poorly. The Canadian Premier League doesn’t have enough transfers to be considered in this analysis. A potential target market could, unsurprisingly, be Africa. Nigeria, Ghana, Tunisia and Algeria all score different flavors of highly by this measure – however, this would be complicated by the difficulty in obtaining video footage or data from the leagues in question.
From a Finnish point of view, the above mentioned German leagues and the Dutch third tier seem the most fertile ground, as well as the Irish Premiership. I also think the Scandinavian second and third tiers could have good potential. In order to expand the pool a little, we’ll keep the Baltic leagues in the mix due to their proximity, and I’m still a little intrigued by the idea about Asian and American leagues, so am going to keep considering the Canadian Premier League, the USL, K2, J2 and J3.
In summary, we’ve used data from transfermarkt to create a rough league quality tiering which has allowed us to analyze which leagues would be interesting to scout for potentially interesting players. In the next part of this series, we’ll try to see if we can find some interesting player targets from some of these leagues for one of the highest profile exits from the Veikkausliiga this summer.
If you liked this post, consider following me on Twitter and you won’t miss the next instalment!

2 thoughts on “Minor League Data Scouting, Part One: finding the right market”